
Bitcoin Price Prediction (BTC): Today, This Week, and November 2026

Bitcoin is trading near $75,200 on 6 November 2026, and the short-term outlook is neutral to bearish.
Today: support at $75,000 - $75,733 (including the 50-week SMA); resistance at 77,950–78,450.
This week (3-9 November): expected range of $76,400 - $80,000 with a slight downside bias.
November 2026: expected range of $72,000 - $85,000. A sustained move above $80,000 would improve the outlook, while a break below $76,400 could expose $74,000–$72,000.
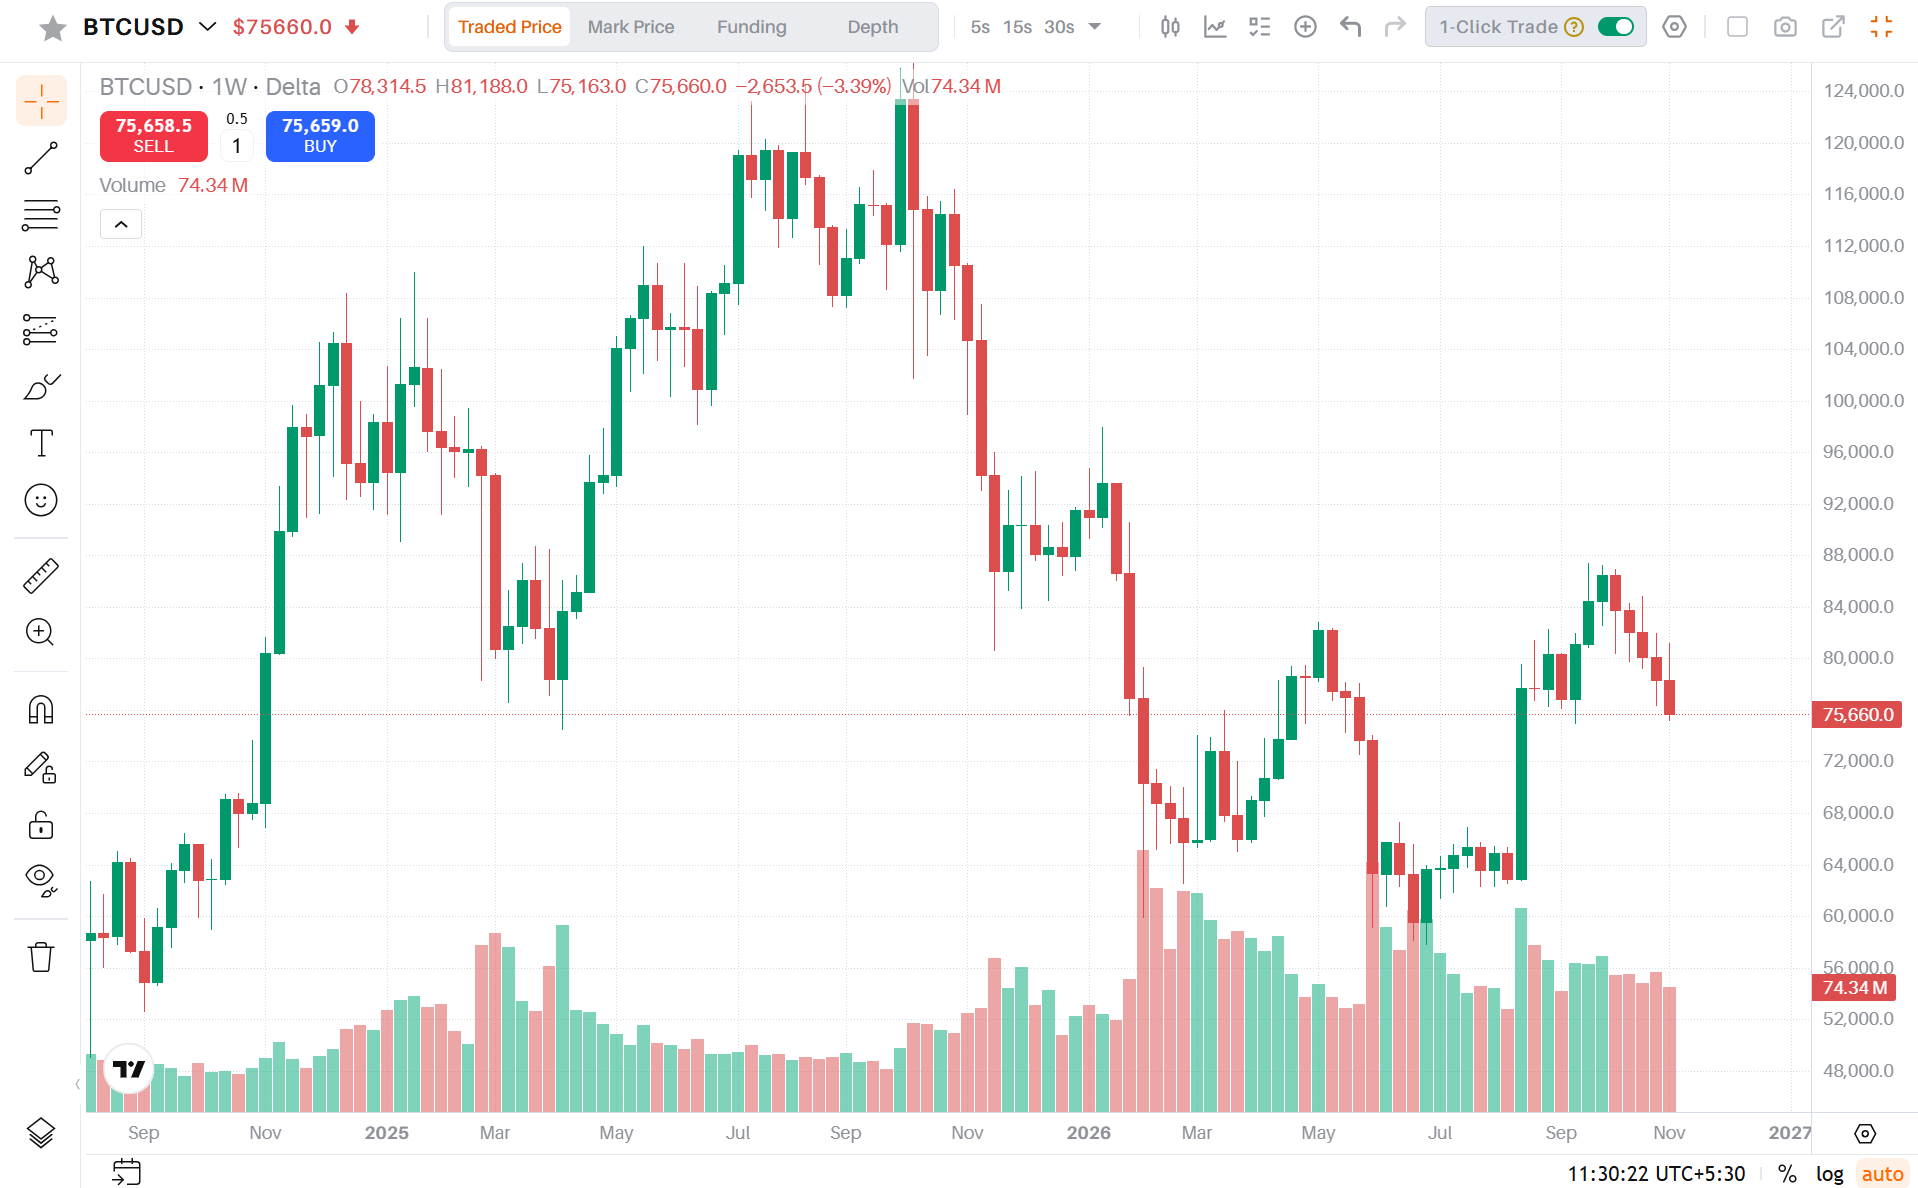
Bitcoin Price Today: Market Snapshot
BTC Price: $75,200
- 24-hour change: approx. -6%
- Weekly change: -2.25%
Today Bitcoin price is under pressure near $75,200 after failing to hold its recovery above $80,000, and the broader trend remains weak. ETF outflows, cautious institutional demand and a sharp selloff in US equities are limiting recovery.
According to Delta Exchange’s daily crypto price analysis for 6 November 2026, Bitcoin is trading near $75,200 after falling nearly 6%, and Ethereum around $2,200 after an almost 8% drop. The reversal followed a sharp decline in US equities that erased post-midterm election gains, with the Nasdaq down 5.52% and the S&P 500 down 4.36% as investors reassessed AI valuations, technology spending and potential policy changes after the Democratic congressional victory. Institutional outflows and macroeconomic uncertainty also keep traders cautious, and the election outcome has put the spotlight on the future of crypto regulation, including renewed efforts around the CLARITY Act, which failed to clear a Senate procedural vote in September.
Traders are also watching today’s US Non-Farm Payrolls report (7:00 PM IST), Federal Reserve rate expectations, oil prices and technology stocks for direction.
Bitcoin Price Prediction Summary
The table below brings together the daily, weekly and monthly outlook for Bitcoin. All figures are ranges and levels to watch, not guaranteed price targets.
Bitcoin Market Sentiment
Sentiment across all three timeframes leans neutral to bearish. Bitcoin is stabilising after recent selling pressure, but demand from institutions is subdued and upside momentum is limited while price stays below $80,000.
Bitcoin Key Support and Resistance Levels
These levels combine the daily, weekly and monthly outlooks. Since BTC is now trading near $75,200, the weekly support at $77,200 sits above price and is worth watching as an area where sellers could appear.
Bitcoin Price Prediction Today (6 November 2026)
BTC is trading near $75,200 after a nearly 6% decline, sitting on its first support zone of $75,000 - $75,733, which includes its 50-week SMA. Bitcoin has fallen below all four major EMAs on the four-hour chart, and resistance is stacked at $77,950 - $78,450. Volatility may persist: 24-hour crypto liquidations reached $1.18 billion, including $1.04 billion in long positions, and Bitcoin’s volatility index surged above 42 before easing toward 40, as markets digest the US equity selloff and macroeconomic developments.
Today's Scenarios
- Bullish: Holding $75,000 - $75,733 and reclaiming $77,950 could lead BTC towards the $78,450 resistance.
- Bearish: A decisive break below $75,000 could extend the correction.
- Sideways: Trading between $75,000 and $77,950 is likely if traders wait for fresh catalysts.
Data to watch today: US Non-Farm Payrolls report, scheduled for 7:00 PM IST, along with US equity market moves, liquidation levels and daily spot ETF flows.
Bitcoin Price Prediction for Tomorrow (7 November)
The same levels remain in focus tomorrow. If BTC holds above $75,000 - $75,733, a retest of the $77,950 - $78,450 resistance zone is possible, especially if US equities stabilise, liquidation pressure eases and employment data comes in softer. A close below $75,000 could extend the correction. As 7 November is a Saturday, US equity markets are closed, so traders will mainly be reacting to the outcome of today’s US jobs report and weekend liquidity.
Bitcoin Price Prediction This Week (3–9 November 2026)
Expected range: $76,400 - $80,000: BTC is likely to remain range-bound with a slight downside risk. A sustained move above $78,700 could open the way towards 80,000–81,000, while a break below $77,200 may expose $76,400.
Key Events This Week
Fed commentary, the US dollar index (DXY), Treasury yields and Bitcoin ETF flows are the other drivers to track. Election uncertainty could add to volatility as investors assess possible changes to US economic and crypto regulatory policy.
Bitcoin Price Prediction for November 2026
Expected trading range: $72,000 - $85,000. Overall outlook: neutral to bearish. Bitcoin enters November after a weak October. A lasting recovery will need stronger spot buying, better ETF flows and a decisive move above key resistance. Until then, downside risks dominate while price trades below $80,000.
What BTC Price Levels Mean in November
- Above $80,000: Bullish momentum could strengthen towards $83,500 - $85,000.
- Between $76,400 and $80,000: Consolidation and continued volatility remain likely.
- Below $76,400: Bearish momentum could accelerate towards $74,000 - $72,000.
November 2026 Macro Calendar
No scheduled Federal Reserve rate decision in November. The next scheduled meeting is December 8 - 9.
Derivatives and Market Positioning
A recovery backed by spot demand and improving ETF inflows would be more sustainable than one driven mainly by leveraged positions. Indicators worth monitoring include aggregate open interest, funding rates and long-short positioning, daily spot ETF net flows, exchange inflows and outflows, and liquidation clusters near major support and resistance levels.
Key Factors Influencing the Bitcoin Price
- US midterm elections and regulation: Changes in Congressional control could shape fiscal priorities, crypto regulation and the chances of the CLARITY Act moving forward.
- Federal Reserve policy: Employment and inflation data will shape expectations for the December FOMC meeting. A more hawkish tone could pressure risk assets.
- Institutional demand: Spot Bitcoin ETF flows are a key gauge of institutional participation. Sustained inflows can support a recovery, while continued outflows may cap upside.
- US dollar and Treasury yields: A stronger dollar and rising yields can drain liquidity from risk assets, while easing yields and a softer dollar may help.
- Oil prices and technology stocks: Moves in these markets can influence overall risk appetite.
How This Bitcoin Price Prediction Is Prepared
This outlook combines support and resistance analysis, derivatives data (open interest, funding rates, long-short positioning and liquidations), spot ETF flows and the scheduled macroeconomic calendar. Predictions are presented as ranges and scenarios rather than fixed targets, because crypto markets can move sharply on unexpected news. The article is refreshed as market conditions change. Market data for 6 November 2026 is based on Delta Exchange’s daily crypto price analysis.
Frequently Asked Questions
- What is the Bitcoin price prediction for today?
Answer: On 6 November 2026, BTC is trading near $75,200. Support sits at $75,000-$75,733, with resistance at $77,950-$78,450. The outlook is neutral to bearish.
- What is the Bitcoin price prediction for this week?
Answer: For 3 to 9 November 2026, BTC is expected to trade between $76,400 and $80,000 with a slight downside bias. A sustained move above $78,700 could open $80,000–$81,000, while a break below $77,200 may expose $76,400 and $75,000.
- What is the Bitcoin price prediction for November 2026?
Answer: The expected November range is $72,000-$85,000. Reclaiming $80,000 could lead towards $83,500-$85,000, while a breakdown below $76,400 could lead towards $74,000-$72,000.
- What are the key Bitcoin support levels right now?
Answer: The nearest supports are $75,000-$75,733 on the daily view (including the 50-week SMA), followed by $74,000 and $72,000 on the monthly view.
- What are the key Bitcoin resistance levels right now?
Answer: Near-term resistance is $77,950-$78,450, followed by $78,700 and the major $80,000 level. Above that, $83,500 and $85,000 are the monthly resistance levels.
- Why is Bitcoin under pressure?
Answer: US spot Bitcoin ETFs recorded $398.6 million in net outflows on 2 November, institutional demand is subdued, and investors are cautious about US elections, inflation data and Federal Reserve policy. On 6 November, a sharp US equity selloff (Nasdaq -5.52%, S&P 500 -4.36%) and $1.18 billion in crypto liquidations added to the pressure.
- Which events could move the Bitcoin price in November?
Answer: The US employment report on 6 November, CPI on 10 November, PPI on 13 November, FOMC minutes on 18 November and PCE inflation with the Beige Book on 25 November are the main scheduled events, along with ETF flows and election-related regulatory news.
- Is there a Federal Reserve rate decision in November 2026?
Answer: No. There is no scheduled FOMC rate decision in November. The next meeting is on 8-9 December.
Disclaimer: This article is for informational and educational purposes only and does not constitute financial, investment or trading advice. Cryptocurrency and derivatives markets are highly volatile, and price predictions are not guarantees of future performance. Please do your own research and consider your risk tolerance before making any decision.